Viewing Column Sizes in Power BI Desktop
When performance tuning Power BI data models, the most important consideration is the size of each column. The tabular model is a columnar database which means the data values are organized by column, allowing for increased compression. Analytic workloads, such as Power BI, benefit greatly from this.
Because the entire data model is loaded in memory, the smaller the data model, the greater the performance gain. The first step in performance tuning is always measurement, and the first measurement is the size of each column. Luckily there is an easy way to do this using DAX Studio and the DISCOVER_STORAGE_TABLE_COLUMNS dynamic management view (DMV).
Open DAX Studio, connect to your Power BI Desktop data model. Behind the scenes, the data model is a SQL Server Analysis Server Tabular Model, so it supports a host of dynamic management views. The query below lists column name, table name, and column size in descending order. Once you identify the largest columns, you can decide if and how to deal with it.
Your optimization options are:
- Delete it if you don’t need it
- Split it (for example split dates and times into two columns, splitting order numbers if they follow a pattern that reuses same values that would benefit from column compression)
- Limit the number of distinct values (meaning group outliers into a catch-all bucket)
- Do nothing, because you need the column
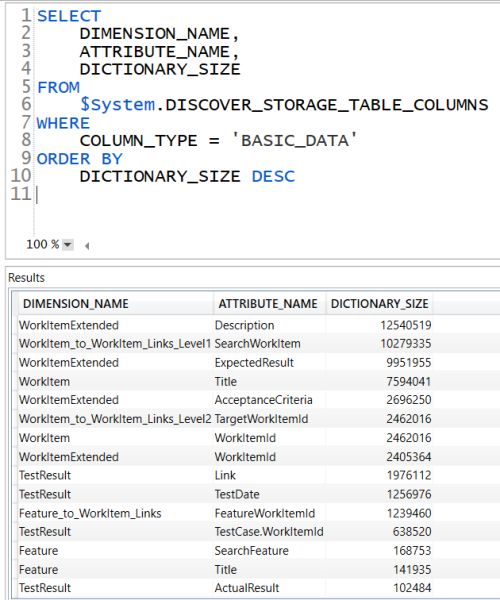
The query:
SELECT
    DIMENSION_NAME,
    ATTRIBUTE_NAME,
    DICTIONARY_SIZE
FROM
    $System.DISCOVER_STORAGE_TABLE_COLUMNS
WHERE
    COLUMN_TYPE = 'BASIC_DATA'
ORDER BY
    DICTIONARY_SIZE DESC