<?xml version="1.0" encoding="utf-8"?><feed xmlns="http://www.w3.org/2005/Atom" ><generator uri="https://jekyllrb.com/" version="3.10.0">Jekyll</generator><link href="http://lance-england.com/feed.xml" rel="self" type="application/atom+xml" /><link href="http://lance-england.com/" rel="alternate" type="text/html" /><updated>2026-01-19T19:07:48+00:00</updated><id>http://lance-england.com/feed.xml</id><title type="html">Lance England</title><subtitle>Data | Analysis | Integration | Automation</subtitle><entry><title type="html">Sharpen the Saw</title><link href="http://lance-england.com/2023/11/sharpen-the-saw.html" rel="alternate" type="text/html" title="Sharpen the Saw" /><published>2023-11-11T00:00:00+00:00</published><updated>2023-11-11T00:00:00+00:00</updated><id>http://lance-england.com/2023/11/sharpen-the-saw</id><content type="html" xml:base="http://lance-england.com/2023/11/sharpen-the-saw.html"><![CDATA[<h1 id="sharpen-the-saw">Sharpen the Saw</h1>

<p><img src="/assets/img/saw.png" alt="Sharpening a blade" /></p>

<p>I am a big proponent of The 7 Habits of Highly Effective People, particularly Habit 7: <a href="https://www.franklincovey.com/the-7-habits/habit-7/">Sharpen the Saw</a>. At the risk of sounding slightly self-promoting, I wanted to share my focus this past year, and current goals for the next few months.</p>

<h2 id="the-certification-gauntlet">The Certification Gauntlet</h2>

<p>Some time ago my interest was piqued by the <a href="https://en.wikipedia.org/wiki/DevOps">DevOps</a> methodology, where development and operations become more integrated to increase the delivery of value to the business. My work experience through <a href="https://www.improving.com/">Improving</a> has given me an opportunity to serve in different roles on multiple projects, from architecting and developing, to deployment and tier-2 operations support. I have seen first-hand the challenges to both initial deployments and subsequent deployments for bug fixes and enhancements. DevOps sounded like a creative solution for addressing these challenges.</p>

<h3 id="az-400">AZ-400</h3>

<p>I signed up for a DevOps boot camp and started working through the material with the goal of passing the <a href="https://learn.microsoft.com/en-us/credentials/certifications/exams/az-400/">Exam AZ-400: Designing and Implementing Microsoft DevOps Solutions</a> exam and obtaining the <a href="https://learn.microsoft.com/en-us/credentials/certifications/devops-engineer/">Microsoft Certified: DevOps Engineer Expert</a> certification. It didn’t take long for me to realize I jumped straight into the deep end and I needed to take a few steps back and focus on some foundational knowledge first. I also discovered the certification has a prerequisite exam that I had missed.</p>

<p>The AZ-400 exam has a choice of two prerequisites exams: either <a href="https://learn.microsoft.com/en-us/credentials/certifications/exams/az-104/">Exam AZ-104: Microsoft Azure Administrator</a>, or <a href="https://learn.microsoft.com/en-us/credentials/certifications/exams/az-204/">Exam AZ-204: Developing Solutions for Microsoft Azure</a>. I felt I had more gaps on the administration path, and decided to pursue the AZ-104.</p>

<h3 id="az-104">AZ-104</h3>

<p>I put the AZ-400 on pause, and poured into the AZ-104 material, using both the Microsoft Learning Paths and <a href="https://learn.cloudlee.io/p/az-104-microsoft-azure-administrator">James Lee’s AZ-104</a> course for my preparation. However, as I neared completion of the course, an opportunity/diversion presented itself.</p>

<p>Microsoft was running a cloud skills challenge during their Build conference, and completion of their Azure Solutions Architect learning path earned a free voucher to sit the <a href="https://learn.microsoft.com/en-us/credentials/certifications/exams/az-305/">Exam AZ-305: Designing Microsoft Azure Infrastructure Solutions</a> exam. The AZ-305 exam is part of two exams for the <a href="https://learn.microsoft.com/en-us/credentials/certifications/azure-solutions-architect/">Microsoft Certified: Azure Solutions Architect Expert</a> certification, and has the same choice of prerequisites as the DevOps Engineer Expert certification. This would give me double the “bang for my buck” for passing the AZ-104 and apply it towards two different expert certifications.</p>

<h3 id="az-305">AZ-305</h3>

<p>So, you guessed it: I paused my preparation for AZ-104 to focus on AZ-305. Both the skills challenge and the free exam voucher itself were limited time offers, so it kept me hyper-focused on getting through the material and scheduling the exam. Man, the things I’ll do for a free voucher!</p>

<p>My preparation for AZ-305 was through my A Cloud Guru subscription, with the instructor yet again James Lee. I can’t recommend James enough as he is thorough, clear, and encouraging in his videos. I passed the AZ-305 exam, but did not yet earn the Azure Solutions Architect certification as I still needed to pass the AZ-104 prerequisite.</p>

<p>With a little confidence boost from passing the AZ-305 exam, I resumed my preparation for the AZ-104. Upon passing the exam, I earned two certifications at once! Passing AZ-104 by itself earns a <a href="https://learn.microsoft.com/en-us/credentials/certifications/azure-administrator/">Microsoft Certified: Azure Administrator Associate</a>, and also combined with my AZ-305 earned the Microsoft Certified: Azure Solutions Architect Expert. Whew!</p>

<p><img src="/assets/img/azure-solutions-architect-200px.png" alt="Microsoft Certified: Azure Solutions Architect Expert badge" /></p>

<p><img src="/assets/img/azure-administrator-200px.png" alt="Microsoft Certified: Azure Administrator Associate badge" /></p>

<h3 id="back-to-az-400">Back to AZ-400</h3>

<p>Finally, it was time to return to the AZ-400 exam. I again used my virtual tutor James Lee to learn all about continuously integrating code with Git repos, and using pipelines to continuously deploy solutions. I felt well-prepared for the exam, but I was caught a little off-guard during the hands-on lab section. It involved more tasks than expected, and I did not allow myself enough time to complete them all. Time management is a key part of sitting an exam. Regardless, I was able to pass and earned the Microsoft Certified: DevOps Engineer Expert certification. Finally!</p>

<p><img src="/assets/img/devops-engineer-200px.png" alt="Microsoft Certified: DevOps Engineer Expert badge" /></p>

<h2 id="reflection">Reflection</h2>

<p>I have jokingly said to a few people that I went a little crazy earning three Microsoft certifications this past year, but honestly, I enjoy the process. Yes, they are stressful. Yes, they require time and energy and focus. However, the exam is a measurable goal with a nice recognition upon completion. The goal gives me a direction for purposeful study, and the preparation guides me through learning new useful skills. Certifications are not a guarantee of anything, but like most things, you get out of it what you put into it.</p>

<h2 id="next-steps">Next Steps</h2>

<p>What now? After some consideration that involved <a href="https://en.wikipedia.org/wiki/Falconry">falconry</a>, <a href="https://en.wikipedia.org/wiki/Cryptozoology">cryptozoology</a>, or starting a <a href="https://en.wikipedia.org/wiki/Chris_Gaines">Chris Gaines</a> cover band, I have zeroed in on three specific goals for the next few months.</p>

<p>One, renew my <a href="https://learn.microsoft.com/en-us/credentials/certifications/power-bi-data-analyst-associate/">Microsoft Certified: Power BI Data Analyst Associate</a> certification. I will always be a data person at heart, and I still get a thrill out of building good data models, shaping data with Power Query, writing <a href="https://learn.microsoft.com/en-us/dax/">DAX</a> measures, and seeing it all come together in reports and dashboards. The new Microsoft renewal process is easy; passing an online assessment will renew my certification for another year. I’ll get to go through the renewal process a lot next year!</p>

<p>Two, obtain the <a href="https://learn.microsoft.com/en-us/credentials/certifications/azure-database-administrator-associate/">Microsoft Certified: Azure Database Administrator Associate</a> certification. SQL Server is like an old friend, but my friend is spending a lot of time in the cloud these days. I want to stay on top of the different Azure SQL options (serverless, elastic pools, etc.) and the exam will guide me through everything I need to know.</p>

<p>Three, and possibly most importantly, focus on hands-on practice building side-projects. The lab portion of the AZ-400 exam reminded me of the importance of this. Instructional learning is great but combining it with practice is the key to deep learning. I have already started my first side-project and will be blogging about the process.</p>

<p>Longer-term, I have some other ideas: diving deeper into modern data engineering, branching into Amazon Web Services, and develop solid Linux fundamentals.</p>

<p>Sharpen the saw.</p>]]></content><author><name></name></author><category term="automation" /><summary type="html"><![CDATA[Sharpen the Saw]]></summary></entry><entry><title type="html">Quicksilver Project - Database</title><link href="http://lance-england.com/2023/10/quicksilver-practice-project-database.html" rel="alternate" type="text/html" title="Quicksilver Project - Database" /><published>2023-10-18T00:00:00+00:00</published><updated>2023-10-18T00:00:00+00:00</updated><id>http://lance-england.com/2023/10/quicksilver-practice-project-database</id><content type="html" xml:base="http://lance-england.com/2023/10/quicksilver-practice-project-database.html"><![CDATA[<h1 id="quicksilver-project---database">Quicksilver Project - Database</h1>

<p>This post is part of a series of getting hands-on practice on a DevOps project:</p>

<ul>
  <li><a href="/2023/10/quicksilver-practice-project-intro.html">Intro</a></li>
  <li><strong>Database</strong></li>
  <li>API (Coming soon)</li>
</ul>

<hr />

<p>Data will be stored in an relational database, specifically an Azure SQL Database. The data model should be fairly stright-forward. My initial model will be intentionaly bare-bones so I can implement a CI/CD pipeline and then add more to it.</p>

<h2 id="entities">Entities</h2>

<p><em>Customer</em> - id, first, last, email. The person requesting a delivery.</p>

<p><em>Package</em> - id, name, size, weight. The item to be delivered.</p>

<p><em>Delivery</em> - id, address, geocode. The destination for the package.</p>

<p><em>Courier</em> - id, first, last, email. The person delivering the package.</p>

<p>Future work will include events (e.g. picked up, out-for-delivery, delivered).</p>

<h2 id="questions">Questions</h2>

<p>Before I get started on design and coding, I have some questions that I will hopefully answer as I’m working through it.</p>

<ul>
  <li>Authentication/Authorization: This could be a good use case for Azure B2C (business-to-customer). How do I integrate that into the Customer and Courier table, and enforce row-level security?</li>
  <li>Does the VSCode SSDT extension work like the Visual Studio SSDT projects? Does it create a DACPAC that can be deployed? Does it support publish profiles?</li>
  <li>How difficult will it be to implement an Azure SQL Database with a Bicep file?</li>
</ul>

<h2 id="getting-started">Getting Started</h2>

<h3 id="development">Development</h3>

<p>First, I opened VSCode and made sure the SQL Database Projects extension was installed. Then opened the Command Pallette (Ctrl+Shift+P) and choose “Database Projects: New” which then gave an option of Azure SQL Database or SQL Server. I’m not exactly sure what the difference means in terms of the extension functionallity, probably the deployment method(?).</p>

<p>Right-clicking he extension toolbar gives options for New Table, New Stored Procedure, etc. so this looks familiar enough to quickly stub out a handful of tables so I can move to the deployment step.</p>

<h3 id="deployment">Deployment</h3>

<p>I’m going to try this multiple ways, each time getting closer to the goal of CI/CD pipeline deployment.</p>

<h4 id="from-vscode">From VSCode</h4>

<p>First, I’ll manually create an Azure SQL Database through the portal and deploy the code from VSCode, to verify the DACPAC deploys as expected.</p>

<p>Azure SQL Databases now have a <a href="https://learn.microsoft.com/en-us/azure/azure-sql/database/free-offer?view=azuresql">free tier</a> perfect for these types of learning excercises. I icked my Entra ID/Azure AD account as the administrator. After the database was created, I set the Server Firewall rule to allow y client IP address.</p>

<p>In VSCode, I choose ‘Publish’ and it launched a basic wizard in the command pallette area, asking for fully-qualified server name, database name, and authentication method. It also allowed me to save a publish profile. Everything worked, so on to the next deployment method.</p>

<h4 id="from-azure-devops-pipeline">From Azure DevOps Pipeline</h4>

<p>From the Azure portal, I dropped/re-created a new empty database. Note: In order to apply the free offer again, you have to delete the logical server too.</p>

<p>Next, I created a new project in Azure DevOps. Back in VSCode, I used the Git extension to initialize a repo. Under Repos in Azure DevOps, I got the URL of the repo and added it as a Remote for my local git repo (the database project) and published it up to Azure Repos.</p>

<p>Next step, creating the pipeline and setting it up to publish to Azure SQL Database. First challenge, getting the build path correct. This took multiple attempts, including using echo $() to see the path and finding this article on <a href="https://learn.microsoft.com/en-us/azure/devops/pipelines/repos/azure-repos-git?view=azure-devops&amp;tabs=yaml#checkout-path">Building Git Repos</a> that mentions the default checkout location of /s. Finally was able to build it with the DotNetCoreCLI@2 task.</p>

<blockquote>
  <p>Moving on to deployment, at time of writing (October 2023) the SqlAzureDacpacDeployment@1 task only works on Windows agents, so be sure your YAML pipeline targets <strong>vmImage: windows-latest</strong>.</p>
</blockquote>

<p>Azure DevOps needs a way to deploy to your Azure sunscription, so first you need to set up an Azure Resource Manager <a href="https://learn.microsoft.com/en-us/azure/devops/pipelines/library/service-endpoints?view=azure-devops&amp;tabs=yaml">Service Connection</a>. The first option is selecting the authentication type that Azure DevOps (AdO) will use when connecting to the Azure subscription. There are six (6) options, and I only have knowledge of two (2) of them, so that is another area to learn more. I choose <em>*Service principle (Automatic)</em> in which AdO will create a Service Principle in the related Azure AD aka Entra ID instance. It allows you pick the scope between Management Group, Subscription, and Resource Group, and assigns the Contributor RBAC role.</p>

<p>My first decision point before creating the pipeline was how much Infrastructure-as-Code to automate. Should I try to automate the creation of the Azure SQL Database/logical server instance in the pipeline? When learning something new, I tend to go for the lowest “friction” route at first; I’d prefer to get a minimum-viable concept working, and can improve/productionize it later. So, I decided to create the Azure SQL Database manually.</p>

<p>Next step, SQL Database permissions. The Subscription-level RBAC Contributor role is for management-plane permissions. In order to allow the AdO service principle to create objects inside the database, it must have some level of SQL Server permissions, which I assigned using T-SQL statements after connecting SQL Management Studio.</p>

<blockquote>
  <p>Note: In the Azure portal, browse to the SQL Database and choose “Set Firewall Rules” and choose the option to allow your client IP address.</p>
</blockquote>

<p>I created a database user mapped to a server login, then assign the role of <strong>db_owner</strong>. In the future, this could be reduced to some combination of ddl_admin, db_datawriter, etc. However, if you plan on defining custom database roles you’’ need to have db_owner or db_securityadmin.</p>

<p>To build a pipeline to deploy the SQL Database Project, I used two tasks:</p>

<ul>
  <li><a href="https://learn.microsoft.com/en-us/azure/devops/pipelines/tasks/reference/dotnet-core-cli-v2?view=azure-pipelines">DotNetCoreCLI@2</a> - to build the project and produce a DACPAC</li>
  <li><a href="https://learn.microsoft.com/en-us/azure/devops/pipelines/tasks/reference/sql-azure-dacpac-deployment-v1?view=azure-pipelines">SqlAzureDacpacDeployment@1</a> - to deploy the DACPAC against the target Azure SQL Database</li>
</ul>

<p>It took a multiple attempts to get the file paths figured out. But these are exactly the type of things you just have to fumble through and learn. I used the <a href="https://learn.microsoft.com/en-us/azure/devops/pipelines/build/variables?view=azure-devops&amp;tabs=yaml">system-variable</a> Agent.BuildDirectory and through runing a script task DIR, I discovered my repo code was under /s. After the fact I discovered a different system-variable, Build.Repository.LocalPath, that gives the path to the repo.</p>

<p>After some trial and error, I was able to build and deploy, hurrah! My YAML pipeline (at this point):</p>

<pre data-enlighter-language="yaml">
trigger:
- main

pool:
  vmImage: windows-latest

steps:
- task: DotNetCoreCLI@2
  inputs:
    command: 'build'
    projects: '**/*.sqlproj'

- task: SqlAzureDacpacDeployment@1
  inputs:
    azureSubscription: 'Visual Studio Enterprise Subscription – MPN(guid redacted)'
    AuthenticationType: 'servicePrincipal'
    ServerName: 'quicksilver-dev-sqlsrv01.database.windows.net'
    DatabaseName: 'QuicksilverDb'
    deployType: 'DacpacTask'
    DeploymentAction: 'Publish'
    DacpacFile: '$(Build.Repository.LocalPath)\s\Quicksilver\bin\Debug\Quicksilver.dacpac'
    IpDetectionMethod: 'AutoDetect'
</pre>

<h2 id="future-steps">Future Steps</h2>

<ul>
  <li>Change the pipeline to trigger off merging a change request.</li>
  <li>Add parameters for values that will change between environment (subscription, resource group, etc.).</li>
  <li>Learn about different Service Principle authentication options.</li>
  <li>Determine how much Infrastructure-as-Code whould be in the Pipeline. For databases, it’s harder to define than application code.</li>
  <li>Reduce the permissons of the service principle in the database, ddl_admin, etc.</li>
  <li>Research the Database Project publish profile options</li>
  <li>Add a task tfor SSDT to generate scripts and add a manual review/approval deployment gate.</li>
  <li>Learn the differences in between the two VSCode Database Project types, Azure SQL Database vs. SQL Server.</li>
</ul>]]></content><author><name></name></author><category term="data" /><category term="automation" /><summary type="html"><![CDATA[Quicksilver Project - Database]]></summary></entry><entry><title type="html">Quicksilver Project - Intro</title><link href="http://lance-england.com/2023/10/quicksilver-practice-project-intro.html" rel="alternate" type="text/html" title="Quicksilver Project - Intro" /><published>2023-10-14T00:00:00+00:00</published><updated>2023-10-14T00:00:00+00:00</updated><id>http://lance-england.com/2023/10/quicksilver-practice-project-intro</id><content type="html" xml:base="http://lance-england.com/2023/10/quicksilver-practice-project-intro.html"><![CDATA[<h1 id="quicksilver-project---intro">Quicksilver Project - Intro</h1>

<p>This post is part of a series of getting hands-on practice on a DevOps project:</p>

<ul>
  <li><strong>Intro</strong></li>
  <li><a href="/2023/10/quicksilver-practice-project-database.html">Database</a></li>
  <li>API (Coming soon)</li>
</ul>

<hr />

<p>This Quicksilver project is simply to get hands-on practice in cloud technologies. Quicksilver is a fictional courier company from an <a href="https://www.imdb.com/title/tt0091814/?ref_=nv_sr_srsg_0_tt_5_nm_3_q_quicksilver">80s movie</a> (credit to co-worker Bill Delaune for coming up with the idea). The goal is to build a basic front-end client and back-end system for customers and couriers to have packages delivered. The code will be a very basic proof-of-concept, but will be built with DevOps principals of source control, continuous integration (CI) and continuous delivery (CD).</p>

<p>Back-end technologies used:</p>

<ul>
  <li>Azure DevOps</li>
  <li>Azure SQL Database</li>
  <li>ASP.net API</li>
  <li>Azure Container Instance</li>
  <li>Azure Maps</li>
  <li>Entra ID (aka Azure AD)</li>
  <li>Azure KeyVault</li>
</ul>

<p>Front-end technologies:</p>

<ul>
  <li>To be determined, probably some super basic web app</li>
</ul>

<h2 id="user-stories">User Stories</h2>

<p>Customer</p>

<ul>
  <li>Create/edit account</li>
  <li>Create/edit package/delivery request</li>
  <li>Authentication/Authorization</li>
</ul>

<p>Courier</p>

<ul>
  <li>Create/edit account</li>
  <li>Create/edit delivery job of package</li>
  <li>Authentication/Authorization</li>
</ul>

<h2 id="implementation">Implementation</h2>

<p>Data will be persisted in Azure SQL Database using an API interface. API will be a C# ASP.net Core container hosted in Azure Container Instance. Azure Maps will be used to translate addresses to Geocodes, and to provide route directions to couriers.</p>

<p>Code will be hosted in either GitHub or Azure DevOps, with CI/CD using Azure Pipelines.</p>

<h2 id="plan-and-random-thoughts">Plan and Random Thoughts</h2>

<p>I’m starting with my wheelhouse, the data model. However, my inital model will be incomplete by design, so that I can then hook up a CI/CD pipeline for further devlopment.</p>

<p>Next, I will implement a very basic API to for CRUD operations against the data model. Again, because the data model will be incomplete, this will also evolve with CI/CD.</p>

<p>I need to determine where and how to handle authentication/authorization for the API. I could put an API Management in front of it, but also want to explore other options.</p>

<p>I prefer the repo to be in GitHub, but will initially use Azure Repos to simplify implementing the pipelines in Azure DevOps. Later, I may try moving the repo to GitHub and either intergrating with Azure DevOps for the pipelines, or use GitHub actions. Or, maybe both just for the experience.</p>

<p>I will use VSCode, including the <a href="https://marketplace.visualstudio.com/items?itemName=ms-mssql.sql-database-projects-vscode">SQL Database Project</a> extension, and for the API use the <a href="https://code.visualstudio.com/docs/devcontainers/containers">Developing Inside a Container</a> functionality.</p>

<p>Infrastructure-as-Code will be defined with <a href="https://learn.microsoft.com/en-us/azure/azure-resource-manager/bicep/overview?tabs=bicep">Bicep</a> files.</p>

<p>The development and production pipelines will target different resources, optimized for cost in development and optimized for scaling in production, while still aiming for cost effectiveness.</p>]]></content><author><name></name></author><category term="data" /><category term="automation" /><summary type="html"><![CDATA[Quicksilver Project - Intro]]></summary></entry><entry><title type="html">Viewing Column Sizes in Power BI Desktop</title><link href="http://lance-england.com/2021/06/viewing-column-sizes-in-power-bi-desktop.html" rel="alternate" type="text/html" title="Viewing Column Sizes in Power BI Desktop" /><published>2021-06-05T00:00:00+00:00</published><updated>2021-06-05T00:00:00+00:00</updated><id>http://lance-england.com/2021/06/viewing-column-sizes-in-power-bi-desktop</id><content type="html" xml:base="http://lance-england.com/2021/06/viewing-column-sizes-in-power-bi-desktop.html"><![CDATA[<h1 id="viewing-column-sizes-in-power-bi-desktop">Viewing Column Sizes in Power BI Desktop</h1>

<p>When performance tuning Power BI data models, the most important consideration is the size of each column. The tabular model is a columnar database which means the data values are organized by column, allowing for increased compression. Analytic workloads, such as Power BI, benefit greatly from this.</p>

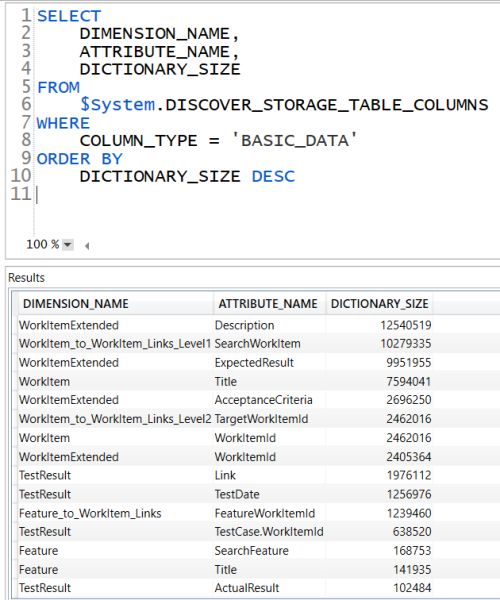
<p>Because the entire data model is loaded in memory, the smaller the data model, the greater the performance gain. The first step in performance tuning is always measurement, and the first measurement is the size of each column. Luckily there is an easy way to do this using <a href="https://daxstudio.org/">DAX Studio</a> and the <a href="https://docs.microsoft.com/en-us/openspecs/sql_server_protocols/ms-ssas/1079969e-b432-48fc-bff7-20ced3a96893">DISCOVER_STORAGE_TABLE_COLUMNS</a> dynamic management view (DMV).</p>

<p>Open DAX Studio, connect to your Power BI Desktop data model. Behind the scenes, the data model is a SQL Server Analysis Server Tabular Model, so it supports a host of dynamic management views. The query below lists column name, table name, and column size in descending order. Once you identify the largest columns, you can decide if and how to deal with it.</p>

<p>Your optimization options are:</p>

<ol>
  <li>Delete it if you don’t need it</li>
  <li>Split it (for example split dates and times into two columns, splitting order numbers if they follow a pattern that reuses same values that would benefit from column compression)</li>
  <li>Limit the number of distinct values (meaning group outliers into a catch-all bucket)</li>
  <li>Do nothing, because you need the column</li>
</ol>

<p>The query:</p>

<pre data-enlighter-language="sql">
SELECT
    DIMENSION_NAME,
    ATTRIBUTE_NAME,
    DICTIONARY_SIZE
FROM
    $System.DISCOVER_STORAGE_TABLE_COLUMNS
WHERE
    COLUMN_TYPE = 'BASIC_DATA'
ORDER BY
    DICTIONARY_SIZE DESC
</pre>

<p><img src="/assets/img/dax_studio_dmv.png" alt="DMV query and results" /></p>]]></content><author><name></name></author><category term="analysis" /><category term="data" /><summary type="html"><![CDATA[Viewing Column Sizes in Power BI Desktop]]></summary></entry><entry><title type="html">Aggregate Changes with T-SQL Window Functions</title><link href="http://lance-england.com/2021/05/aggregate-changes-with-t-sql-window-functions.html" rel="alternate" type="text/html" title="Aggregate Changes with T-SQL Window Functions" /><published>2021-05-03T00:00:00+00:00</published><updated>2021-05-03T00:00:00+00:00</updated><id>http://lance-england.com/2021/05/aggregate-changes-with-t-sql-window-functions</id><content type="html" xml:base="http://lance-england.com/2021/05/aggregate-changes-with-t-sql-window-functions.html"><![CDATA[<h1 id="aggregate-changes-with-t-sql-window-functions">Aggregate Changes with T-SQL Window Functions</h1>

<p>Recently I was presented an interesting data challenge. A database would import data feeds at the detail level of one row per patient, per month, per amount type. The output of the database would be a summary, where one row would represent the start and end period of unchanged values. Each change in amount (in chronological order) or a skipped period (or periods) would trigger a new row.</p>

<p>For example, in the table below</p>

<ol>
  <li>PatientId ‘1234’ no changes for January 2020 - December 2020</li>
  <li>PatientId ‘2345’ has a new Amount starting in June 2020</li>
  <li>PatientId ‘3456’ has a gap for June - July 2020</li>
</ol>

<p>The table below shows mocked up sample input data.</p>

<table>
  <thead>
    <tr>
      <th>PatientId</th>
      <th>PeriodStartDate</th>
      <th>PeriodEndDate</th>
      <th>AmountType</th>
      <th>Amount</th>
    </tr>
  </thead>
  <tbody>
    <tr>
      <td>1234</td>
      <td>1/1/2020</td>
      <td>1/31/2020</td>
      <td>EW</td>
      <td>100</td>
    </tr>
    <tr>
      <td>1234</td>
      <td>2/1/2020</td>
      <td>2/29/2020</td>
      <td>EW</td>
      <td>100</td>
    </tr>
    <tr>
      <td>1234</td>
      <td>3/1/2020</td>
      <td>3/31/2020</td>
      <td>EW</td>
      <td>100</td>
    </tr>
    <tr>
      <td>1234</td>
      <td>4/1/2020</td>
      <td>4/30/2020</td>
      <td>EW</td>
      <td>100</td>
    </tr>
    <tr>
      <td>1234</td>
      <td>5/1/2020</td>
      <td>5/31/2020</td>
      <td>EW</td>
      <td>100</td>
    </tr>
    <tr>
      <td>1234</td>
      <td>6/1/2020</td>
      <td>6/30/2020</td>
      <td>EW</td>
      <td>100</td>
    </tr>
    <tr>
      <td>1234</td>
      <td>7/1/2020</td>
      <td>7/31/2020</td>
      <td>EW</td>
      <td>100</td>
    </tr>
    <tr>
      <td>1234</td>
      <td>8/1/2020</td>
      <td>8/31/2020</td>
      <td>EW</td>
      <td>100</td>
    </tr>
    <tr>
      <td>1234</td>
      <td>9/1/2020</td>
      <td>9/30/2020</td>
      <td>EW</td>
      <td>100</td>
    </tr>
    <tr>
      <td>1234</td>
      <td>10/1/2020</td>
      <td>10/31/2020</td>
      <td>EW</td>
      <td>100</td>
    </tr>
    <tr>
      <td>1234</td>
      <td>11/1/2020</td>
      <td>11/30/2020</td>
      <td>EW</td>
      <td>100</td>
    </tr>
    <tr>
      <td>1234</td>
      <td>12/1/2020</td>
      <td>12/31/2020</td>
      <td>EW</td>
      <td>100</td>
    </tr>
    <tr>
      <td>2345</td>
      <td>1/1/2020</td>
      <td>1/31/2020</td>
      <td>EW</td>
      <td>100</td>
    </tr>
    <tr>
      <td>2345</td>
      <td>2/1/2020</td>
      <td>2/29/2020</td>
      <td>EW</td>
      <td>100</td>
    </tr>
    <tr>
      <td>2345</td>
      <td>3/1/2020</td>
      <td>3/31/2020</td>
      <td>EW</td>
      <td>100</td>
    </tr>
    <tr>
      <td>2345</td>
      <td>4/1/2020</td>
      <td>4/30/2020</td>
      <td>EW</td>
      <td>100</td>
    </tr>
    <tr>
      <td>2345</td>
      <td>5/1/2020</td>
      <td>5/31/2020</td>
      <td>EW</td>
      <td>100</td>
    </tr>
    <tr>
      <td>2345</td>
      <td>6/1/2020</td>
      <td>6/30/2020</td>
      <td>EW</td>
      <td>125</td>
    </tr>
    <tr>
      <td>2345</td>
      <td>7/1/2020</td>
      <td>7/31/2020</td>
      <td>EW</td>
      <td>125</td>
    </tr>
    <tr>
      <td>2345</td>
      <td>8/1/2020</td>
      <td>8/31/2020</td>
      <td>EW</td>
      <td>125</td>
    </tr>
    <tr>
      <td>2345</td>
      <td>9/1/2020</td>
      <td>9/30/2020</td>
      <td>EW</td>
      <td>125</td>
    </tr>
    <tr>
      <td>2345</td>
      <td>10/1/2020</td>
      <td>10/31/2020</td>
      <td>EW</td>
      <td>125</td>
    </tr>
    <tr>
      <td>2345</td>
      <td>11/1/2020</td>
      <td>11/30/2020</td>
      <td>EW</td>
      <td>125</td>
    </tr>
    <tr>
      <td>2345</td>
      <td>12/1/2020</td>
      <td>12/31/2020</td>
      <td>EW</td>
      <td>125</td>
    </tr>
    <tr>
      <td>2345</td>
      <td>1/1/2020</td>
      <td>12/31/2020</td>
      <td>C5</td>
      <td>5</td>
    </tr>
    <tr>
      <td>3456</td>
      <td>1/1/2020</td>
      <td>1/31/2020</td>
      <td>EW</td>
      <td>100</td>
    </tr>
    <tr>
      <td>3456</td>
      <td>2/1/2020</td>
      <td>2/29/2020</td>
      <td>EW</td>
      <td>100</td>
    </tr>
    <tr>
      <td>3456</td>
      <td>3/1/2020</td>
      <td>3/31/2020</td>
      <td>EW</td>
      <td>100</td>
    </tr>
    <tr>
      <td>3456</td>
      <td>4/1/2020</td>
      <td>4/30/2020</td>
      <td>EW</td>
      <td>100</td>
    </tr>
    <tr>
      <td>3456</td>
      <td>5/1/2020</td>
      <td>5/31/2020</td>
      <td>EW</td>
      <td>100</td>
    </tr>
    <tr>
      <td>3456</td>
      <td>8/1/2020</td>
      <td>8/31/2020</td>
      <td>EW</td>
      <td>100</td>
    </tr>
    <tr>
      <td>3456</td>
      <td>9/1/2020</td>
      <td>9/30/2020</td>
      <td>EW</td>
      <td>100</td>
    </tr>
    <tr>
      <td>3456</td>
      <td>10/1/2020</td>
      <td>10/31/2020</td>
      <td>EW</td>
      <td>100</td>
    </tr>
    <tr>
      <td>3456</td>
      <td>11/1/2020</td>
      <td>11/30/2020</td>
      <td>EW</td>
      <td>100</td>
    </tr>
    <tr>
      <td>3456</td>
      <td>12/1/2020</td>
      <td>12/31/2020</td>
      <td>EW</td>
      <td>100</td>
    </tr>
  </tbody>
</table>

<p>The table below shows the output summary with changes data.</p>

<table>
  <thead>
    <tr>
      <th>PatientId</th>
      <th>PeriodStartDate</th>
      <th>PeriodEndDate</th>
      <th>AmountType</th>
      <th>Amount</th>
    </tr>
  </thead>
  <tbody>
    <tr>
      <td>1234</td>
      <td>1/1/2020</td>
      <td>12/31/2020</td>
      <td>EW</td>
      <td>100</td>
    </tr>
    <tr>
      <td>2345</td>
      <td>1/1/2020</td>
      <td>12/31/2020</td>
      <td>C5</td>
      <td>5</td>
    </tr>
    <tr>
      <td>2345</td>
      <td>1/1/2020</td>
      <td>5/31/2020</td>
      <td>EW</td>
      <td>100</td>
    </tr>
    <tr>
      <td>2345</td>
      <td>6/1/2020</td>
      <td>12/31/2020</td>
      <td>EW</td>
      <td>125</td>
    </tr>
    <tr>
      <td>3456</td>
      <td>1/1/2020</td>
      <td>5/31/2020</td>
      <td>EW</td>
      <td>100</td>
    </tr>
    <tr>
      <td>3456</td>
      <td>8/1/2020</td>
      <td>12/31/2020</td>
      <td>EW</td>
      <td>100</td>
    </tr>
  </tbody>
</table>

<p>The solution involved a few <a href="https://docs.microsoft.com/sql/t-sql/queries/with-common-table-expression-transact-sql?view=sql-server-ver15">common table expressions</a> and a few T-SQL <a href="https://docs.microsoft.com/sql/t-sql/queries/select-over-clause-transact-sql?view=sql-server-ver15">window functions</a>. Let’s walk through each step/CTE.</p>

<h2 id="step-1-detect-changes">Step 1: Detect Changes</h2>

<p>The important bits are on lines 7 and 8. Line 7 uses the <a href="https://docs.microsoft.com/sql/t-sql/functions/lag-transact-sql?view=sql-server-ver15">LAG function</a> to calculate the amount change between the previous row and current row. The first row would return NULL. We want the first row to be flagged as a ‘change’, so the ISNULL function replaces NULL with -1 ( i.e. not equals $0 to indicate a change).</p>

<p>Line 8 is similar in that it calculates the date difference in months between the previous row and current row. Each row is expected to represent a month, so the expected value is 1. We also use ISNULL to add -1 to the first row i.e. any value not equal to 1 indicates a change.</p>

<pre data-enlighter-language="sql">
SELECT
       PatientId,
       PeriodStartDate,
       PeriodEndDate,
       AmountType,
       Amount,
       ISNULL(Amount - LAG(Amount, 1) OVER (PARTITION BY PatientId, AmountType ORDER BY PeriodStartDate), -1) AS AmtDiff,
       ISNULL(DATEDIFF(month, LAG(PeriodStartDate, 1) OVER (PARTITION BY PatientId, AmountType ORDER BY PeriodStartDate), PeriodStartDate), -1) AS PeriodDiff
FROM
       dbo.PatientSubsidy
WHERE
       PeriodStartDate BETWEEN @PeriodStartDate AND @PeriodStartDate
</pre>

<h2 id="step-2-assign-a-group-number">Step 2: Assign a Group Number</h2>

<p>The query from step 1 is referenced in step 2 as ‘cte_detectChanges’. The important bit in step 2 is on line 7-9. Line 7 conditionally sums a ‘1’ if any change in amount or period was detected from step 1, or a ‘0’ if no change. This effectively assigns a group number for each sequential block with no change.</p>

<pre data-enlighter-language="sql">
SELECT
       PatientId,
       PeriodStartDate,
       PeriodEndDate,
       AmountType,
       Amount,
       SUM(
              CASE WHEN AmtDiff &lt;&gt; 0 or PeriodDiff &lt;&gt; 1 THEN 1 ELSE 0 END
       ) OVER (ORDER BY PatientId, AmountType, PeriodStartDate) AS GroupNumber
FROM
       cte_detectChanges
</pre>

<p>The un-aggregated results of step 2 would look like the following table:</p>

<table>
  <thead>
    <tr>
      <th>PatientId</th>
      <th>PeriodStartDate</th>
      <th>PeriodEndDate</th>
      <th>AmountType</th>
      <th>Amount</th>
      <th>GroupNumber</th>
    </tr>
  </thead>
  <tbody>
    <tr>
      <td>1234</td>
      <td>1/1/2020</td>
      <td>1/31/2020</td>
      <td>EW</td>
      <td>100</td>
      <td>1</td>
    </tr>
    <tr>
      <td>1234</td>
      <td>2/1/2020</td>
      <td>2/29/2020</td>
      <td>EW</td>
      <td>100</td>
      <td>1</td>
    </tr>
    <tr>
      <td>1234</td>
      <td>3/1/2020</td>
      <td>3/31/2020</td>
      <td>EW</td>
      <td>100</td>
      <td>1</td>
    </tr>
    <tr>
      <td>1234</td>
      <td>4/1/2020</td>
      <td>4/30/2020</td>
      <td>EW</td>
      <td>100</td>
      <td>1</td>
    </tr>
    <tr>
      <td>1234</td>
      <td>5/1/2020</td>
      <td>5/31/2020</td>
      <td>EW</td>
      <td>100</td>
      <td>1</td>
    </tr>
    <tr>
      <td>1234</td>
      <td>6/1/2020</td>
      <td>6/30/2020</td>
      <td>EW</td>
      <td>100</td>
      <td>1</td>
    </tr>
    <tr>
      <td>1234</td>
      <td>7/1/2020</td>
      <td>7/31/2020</td>
      <td>EW</td>
      <td>100</td>
      <td>1</td>
    </tr>
    <tr>
      <td>1234</td>
      <td>8/1/2020</td>
      <td>8/31/2020</td>
      <td>EW</td>
      <td>100</td>
      <td>1</td>
    </tr>
    <tr>
      <td>1234</td>
      <td>9/1/2020</td>
      <td>9/30/2020</td>
      <td>EW</td>
      <td>100</td>
      <td>1</td>
    </tr>
    <tr>
      <td>1234</td>
      <td>10/1/2020</td>
      <td>10/31/2020</td>
      <td>EW</td>
      <td>100</td>
      <td>1</td>
    </tr>
    <tr>
      <td>1234</td>
      <td>11/1/2020</td>
      <td>11/30/2020</td>
      <td>EW</td>
      <td>100</td>
      <td>1</td>
    </tr>
    <tr>
      <td>1234</td>
      <td>12/1/2020</td>
      <td>12/31/2020</td>
      <td>EW</td>
      <td>100</td>
      <td>1</td>
    </tr>
    <tr>
      <td>2345</td>
      <td>1/1/2020</td>
      <td>12/31/2020</td>
      <td>C5</td>
      <td>5</td>
      <td>2</td>
    </tr>
    <tr>
      <td>2345</td>
      <td>1/1/2020</td>
      <td>1/31/2020</td>
      <td>EW</td>
      <td>100</td>
      <td>3</td>
    </tr>
    <tr>
      <td>2345</td>
      <td>2/1/2020</td>
      <td>2/29/2020</td>
      <td>EW</td>
      <td>100</td>
      <td>3</td>
    </tr>
    <tr>
      <td>2345</td>
      <td>3/1/2020</td>
      <td>3/31/2020</td>
      <td>EW</td>
      <td>100</td>
      <td>3</td>
    </tr>
    <tr>
      <td>2345</td>
      <td>4/1/2020</td>
      <td>4/30/2020</td>
      <td>EW</td>
      <td>100</td>
      <td>3</td>
    </tr>
    <tr>
      <td>2345</td>
      <td>5/1/2020</td>
      <td>5/31/2020</td>
      <td>EW</td>
      <td>100</td>
      <td>3</td>
    </tr>
    <tr>
      <td>2345</td>
      <td>6/1/2020</td>
      <td>6/30/2020</td>
      <td>EW</td>
      <td>125</td>
      <td>4</td>
    </tr>
    <tr>
      <td>2345</td>
      <td>7/1/2020</td>
      <td>7/31/2020</td>
      <td>EW</td>
      <td>125</td>
      <td>4</td>
    </tr>
    <tr>
      <td>2345</td>
      <td>8/1/2020</td>
      <td>8/31/2020</td>
      <td>EW</td>
      <td>125</td>
      <td>4</td>
    </tr>
    <tr>
      <td>2345</td>
      <td>9/1/2020</td>
      <td>9/30/2020</td>
      <td>EW</td>
      <td>125</td>
      <td>4</td>
    </tr>
    <tr>
      <td>2345</td>
      <td>10/1/2020</td>
      <td>10/31/2020</td>
      <td>EW</td>
      <td>125</td>
      <td>4</td>
    </tr>
    <tr>
      <td>2345</td>
      <td>11/1/2020</td>
      <td>11/30/2020</td>
      <td>EW</td>
      <td>125</td>
      <td>4</td>
    </tr>
    <tr>
      <td>2345</td>
      <td>12/1/2020</td>
      <td>12/31/2020</td>
      <td>EW</td>
      <td>125</td>
      <td>4</td>
    </tr>
    <tr>
      <td>3456</td>
      <td>1/1/2020</td>
      <td>1/31/2020</td>
      <td>EW</td>
      <td>100</td>
      <td>5</td>
    </tr>
    <tr>
      <td>3456</td>
      <td>2/1/2020</td>
      <td>2/29/2020</td>
      <td>EW</td>
      <td>100</td>
      <td>5</td>
    </tr>
    <tr>
      <td>3456</td>
      <td>3/1/2020</td>
      <td>3/31/2020</td>
      <td>EW</td>
      <td>100</td>
      <td>5</td>
    </tr>
    <tr>
      <td>3456</td>
      <td>4/1/2020</td>
      <td>4/30/2020</td>
      <td>EW</td>
      <td>100</td>
      <td>5</td>
    </tr>
    <tr>
      <td>3456</td>
      <td>5/1/2020</td>
      <td>5/31/2020</td>
      <td>EW</td>
      <td>100</td>
      <td>5</td>
    </tr>
    <tr>
      <td>3456</td>
      <td>8/1/2020</td>
      <td>8/31/2020</td>
      <td>EW</td>
      <td>100</td>
      <td>6</td>
    </tr>
    <tr>
      <td>3456</td>
      <td>9/1/2020</td>
      <td>9/30/2020</td>
      <td>EW</td>
      <td>100</td>
      <td>6</td>
    </tr>
    <tr>
      <td>3456</td>
      <td>10/1/2020</td>
      <td>10/31/2020</td>
      <td>EW</td>
      <td>100</td>
      <td>6</td>
    </tr>
    <tr>
      <td>3456</td>
      <td>11/1/2020</td>
      <td>11/30/2020</td>
      <td>EW</td>
      <td>100</td>
      <td>6</td>
    </tr>
    <tr>
      <td>3456</td>
      <td>12/1/2020</td>
      <td>12/31/2020</td>
      <td>EW</td>
      <td>100</td>
      <td>6</td>
    </tr>
  </tbody>
</table>

<h2 id="step-3-aggregate-the-data">Step 3: Aggregate the Data</h2>

<p>The query from step 2 is referenced in the final step as ‘cte_AssignGroupNumber’. The important bits here are grouping on PatientId, AmountType, Amount, <em>and</em> the new GroupNumber created in step 2. We get the minimum start period and maximum end period for each group.</p>

<pre data-enlighter-language="sql">
SELECT
       PatientId,
       AmountType,
       MIN(PeriodStartDate) AS PeriodStartDate,
       MAX(PeriodEndDate) AS PeriodEndDate,
       Amount
FROM
       cte_AssignGroupNumber
GROUP BY
       PatientId,
       AmountType,
       Amount,
       GroupNumber
ORDER BY
       PatientId,
       AmountType,
       PeriodStartDate
;
</pre>

<h2 id="complete-query">Complete Query</h2>

<p>The complete query is below. Volume and usage patterns will dictate how to organize the clustered index. It is anticipated that this will be a batch load/extract process with no additional non-clustered indexes, so the initial clustered index will probably be on PeriodStartDate.</p>

<pre data-enlighter-language="sql">
DECLARE
       @PeriodStartDate DATE = '2020-01-01',
       @PeriodStartDate DATE = '2020-12-31'
;

WITH cte_detectChanges AS (
SELECT
       PatientId,
       PeriodStartDate,
       PeriodEndDate,
       AmountType,
       Amount,
       ISNULL(Amount - LAG(Amount, 1) OVER (PARTITION BY PatientId, AmountType ORDER BY PeriodStartDate), -1) AS AmtDiff,
       ISNULL(DATEDIFF(month, LAG(PeriodStartDate, 1) OVER (PARTITION BY PatientId, AmountType ORDER BY PeriodStartDate), PeriodStartDate), -1) AS PeriodDiff
FROM
       dbo.PatientSubsidy
WHERE
       PeriodStartDate BETWEEN @PeriodStartDate AND @PeriodStartDate
),
cte_AssignGroupNumber as (
       SELECT
              PatientId,
              PeriodStartDate,
              PeriodEndDate,
              AmountType,
              Amount,
              SUM(
                     CASE WHEN AmtDiff &lt;&gt; 0 or PeriodDiff &lt;&gt; 1 THEN 1 ELSE 0 END
              ) OVER (ORDER BY PatientId, AmountType, PeriodStartDate) AS GroupNumber
       FROM
              cte_detectChanges
)
SELECT
       PatientId,
       AmountType,
       MIN(PeriodStartDate) AS PeriodStartDate,
       MAX(PeriodEndDate) AS PeriodEndDate,
       Amount
FROM
       cte_AssignGroupNumber
GROUP BY
       PatientId,
       AmountType,
       Amount,
       GroupNumber
ORDER BY
       PatientId,
       AmountType,
       PeriodStartDate
;
</pre>]]></content><author><name></name></author><category term="analysis" /><summary type="html"><![CDATA[Aggregate Changes with T-SQL Window Functions]]></summary></entry><entry><title type="html">Goodbye, SQL PASS</title><link href="http://lance-england.com/2021/01/goodbye_sqlpass.html" rel="alternate" type="text/html" title="Goodbye, SQL PASS" /><published>2021-01-14T00:00:00+00:00</published><updated>2021-01-14T00:00:00+00:00</updated><id>http://lance-england.com/2021/01/goodbye_sqlpass</id><content type="html" xml:base="http://lance-england.com/2021/01/goodbye_sqlpass.html"><![CDATA[<h1 id="goodbye-sql-pass">Goodbye, SQL PASS</h1>

<p>SQL Pass (or PASS) has been a great amplifier of both community and professional development for thousands. I was saddened by their recent announcement:</p>

<blockquote>
  <p>We are saddened to tell you that, due to the impact of COVID-19, PASS is ceasing all regular operations, effective January 15, 2021.</p>
</blockquote>

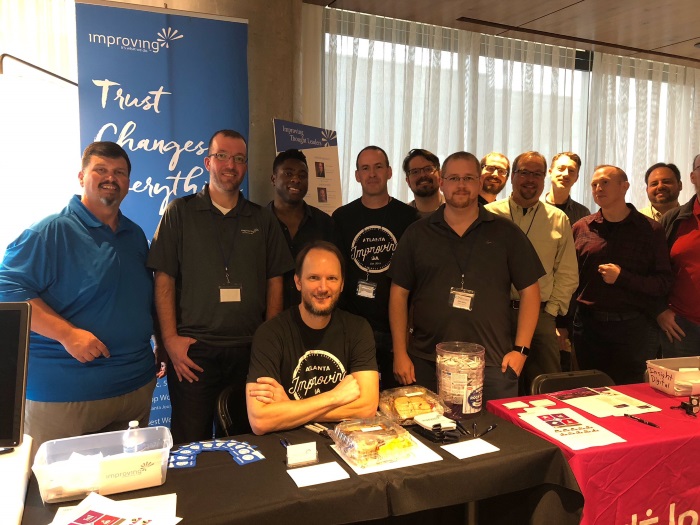
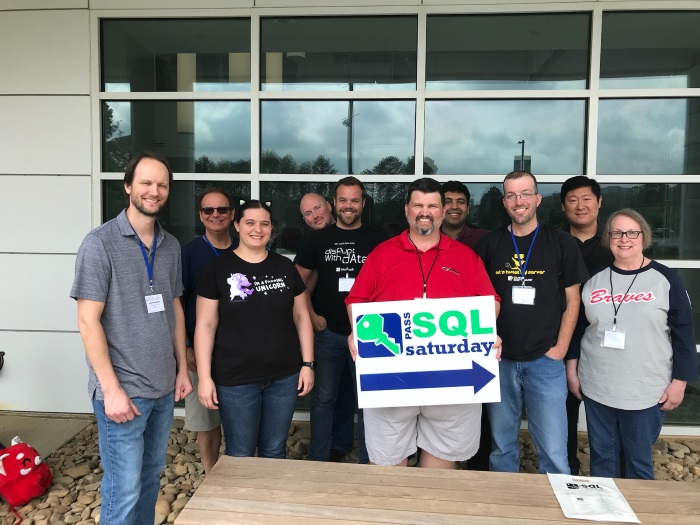
<p>I have spoken at three different SQL Saturday events. I was SO nervous the first time that after my session I just had to go sit in my car in the parking lot and close my eyes. But it was a thrill. My favorite SQL Saturday was the last one I spoke at, because I was there not just representing myself, but also <a href="https://improving.com/location/atlanta">Improving - Atlanta</a>. Experiencing the event as a team was that much more rewarding.</p>

<p><img src="/assets/img/sqlsat919-group.jpg" alt="Improving team inside" /></p>

<p><img src="/assets/img/sqlsat919-group-outside.jpg" alt="Improving team outside" /></p>

<p>Ultimately, the community is bigger than just SQL PASS. Already virtual groups are migrating to Meetup and other platforms. SQL Saturdays will likely re-emerge under a different name. That said, I still hate to see SQL PASS cease operations. Thank you to all who served as board members, volunteers, and staff.</p>

<p>Goodbye, SQL PASS, and thanks for the memories.</p>]]></content><author><name></name></author><category term="data" /><summary type="html"><![CDATA[Goodbye, SQL PASS]]></summary></entry><entry><title type="html">Passing the DA-100 Exam - Study Notes</title><link href="http://lance-england.com/2020/12/da100-study-notes.html" rel="alternate" type="text/html" title="Passing the DA-100 Exam - Study Notes" /><published>2020-12-22T00:00:00+00:00</published><updated>2020-12-22T00:00:00+00:00</updated><id>http://lance-england.com/2020/12/da100-study-notes</id><content type="html" xml:base="http://lance-england.com/2020/12/da100-study-notes.html"><![CDATA[<h1 id="passing-the-da-100-exam---study-notes">Passing the DA-100 Exam - Study Notes</h1>

<p>I recently passed <a href="https://docs.microsoft.com/en-us/learn/certifications/exams/da-100">Exam DA-100: Analyzing Data with Microsoft Power BI</a> and earned <a href="https://docs.microsoft.com/en-us/learn/certifications/data-analyst-associate">Microsoft Certified: Data Analyst Associate</a>. The DA-100 is the new role-based replacement for <a href="https://docs.microsoft.com/en-us/learn/certifications/exams/70-778">Exam 70-778: Analyzing and Visualizing Data with Microsoft Power BI</a> which retires January 31, 2021. While much of the exam content overlaps, the skills measured has expanded and the weights adjusted. Luckily, Microsoft has done a really nice job with their free learning paths to prepare for the exam.</p>

<h2 id="preparation">Preparation</h2>

<p>The learning paths are listed at the bottom of the <a href="https://docs.microsoft.com/en-us/learn/certifications/exams/da-100">exam page</a>. They walk through all the features and link to related Microsoft Docs pages for more information. In addition, they offer ‘sandbox’ labs to give hands-on practice for the topics. While not a replacement for working experience with Power BI, they are still an excellent way to work through the presented topics.</p>

<p>The following are notes I compiled during exam preparation. All notes are from the learning paths and related documentation. They are NOT comprehensive of everything on the exam, and shouldn’t be considered a replacement for preparation. I wanted to create a quick way to review the learning objectives the morning of the exam. To all pursuing the DA-100, I wish you the best of luck!</p>

<p><a href="https://www.youracclaim.com/badges/7ea11b78-eeef-4cba-8bc3-2fbbcb4519e9/public_url"><img src="/assets/img/microsoft-analyst-associate.png" alt="Microsoft Certified: Data Analyst Associate" /></a></p>

<h2 id="get-started-with-microsoft-data-analytics">Get started with Microsoft data analytics</h2>

<p><a href="https://docs.microsoft.com/en-us/learn/paths/data-analytics-microsoft/">2 Modules</a></p>

<p>This learning path summarizes the types of analytics, related roles, and parts of the Power BI platform.</p>

<h3 id="i-discover-data-analysis">I. Discover data analysis</h3>

<p>Analytics categories:</p>

<ul>
  <li>Descriptive - what</li>
  <li>Diagnostic - why</li>
  <li>Predictive - trends, eg neural networks, decision trees, regression</li>
  <li>Prescriptive - how to hit target, eg machine learning on past data sets</li>
  <li>Cognitive - Draw inferences from data, and add the findings back to knowledge base for self-learning loop</li>
</ul>

<p>Roles:</p>

<ul>
  <li>Business analyst - closer to the business</li>
  <li>Data analyst - reporting specialist, manage reports, data sets, dashboards, etc. The exam is on Data Analyst! The DA tasks are the objectives of the exam</li>
  <li>Data engineer - data flow and integration</li>
  <li>Data scientist - extract value from data through analytics</li>
  <li>Database administrator - operational aspect of data platform</li>
</ul>

<h3 id="ii-get-started-building-with-power-bi">II. Get started building with Power BI</h3>

<p>Power BI is:</p>

<ul>
  <li>Power BI Desktop</li>
  <li>Power BI service</li>
  <li>Power BI mobile</li>
</ul>

<p>Building blocks in Power BI:</p>

<ul>
  <li>Visualizations - visual representation of data</li>
  <li>Datasets - collection of data</li>
  <li>Reports - collection of visualizations on one or more pages</li>
  <li>Dashboards - collection of visualizations form one page</li>
  <li>Tiles - single visualization</li>
</ul>

<p>App - a collection of preset visuals, data, reports packaged to share</p>

<h2 id="prepare-data-for-analysis">Prepare data for analysis</h2>

<p><a href="https://docs.microsoft.com/en-us/learn/paths/prepare-data-power-bi/">2 modules</a></p>

<p>This learning path how to connect to various data sources and transform it.</p>

<h3 id="i-get-data-in-power-bi">I. Get data in Power BI</h3>

<p>A variety of data source connectors built-in e.g. flat file, relation, NoSql, multi-dimensional, on-line</p>

<p>Storage modes:</p>

<ul>
  <li>Import</li>
  <li>DirectQuery</li>
  <li>Dual (Composite)</li>
</ul>

<p>Additional option for connecting to multidimensional i.e. Analysis Services is called Connect Live (formerly named Live Connect).</p>

<p>Both import and DirectQuery go through Power Query (Connect Live does NOT). Power Query can optimize source queries in some circumstances. The process is called query folding. Any transformation that has an anagalous SQL statement e.g WHERE, GROUP BY, SORT, UNION ALL, and JOIN can generally be folded.</p>

<p>Query Diagnostics is a tool new to me that is part of Power Query. Enable diagnostics, refresh the source(s), then stop the diagnostics. It presents information for each transformation step!</p>

<p>Optimization techniques:</p>

<ul>
  <li>Process as much at source as possible</li>
  <li>For Direct Query, use native SQL and not stored procs or CTEs</li>
  <li>For Import from relational, don’t use embedded SQL as Power Query will NOT perform query folding</li>
  <li>Split date and time columns (this is really a data modeling optimization) as it increase compression (smaller memory footprint).</li>
</ul>

<p>Power Query also has tools to view data quality, column distribution, and column profile.</p>

<p>Distinct values count makes sense. Unique values count sounds like the same thing, but its the number of values that only appear once.</p>

<p>Power Query examines the first 1000 rows by default. Change this by clicking the profiling status in the status bar and select ‘Column profiling based on entire data set’.</p>

<h3 id="ii-clean-transform-and-load-data-in-power-bi">II. Clean, transform, and load data in Power BI</h3>

<p>Append queries are like SQL UNION ALL.</p>

<p>Merge queries are like SQL JOIN (INNER, LEFT OUTER, FULL OUTER)</p>

<h2 id="model-data-in-power-bi">Model data in Power BI</h2>

<p><a href="https://docs.microsoft.com/en-us/learn/paths/model-power-bi/">3 modules</a></p>

<h3 id="i-design-a-data-model-in-power-bi">I. Design a data model in Power BI</h3>

<p>Date Table - can be imported from a DW (best), built in Power Query (great), built with DAX (good).</p>

<p><strong>Power Query</strong> - = List.Dates(#date(2011,05,31), 365*10, #duration(1,0,0,0)) Then convert the List to Table, then add columns as needed. There are many built-in date conversions in the UI. Highlight the date column, Add Column -&gt; Date (in the From Date &amp; Time group).</p>

<p><strong>DAX</strong> - CALENDAR or CALENDARAUTO, then add each column e.g. DayOfMonth, Year, etc. The table won’t compress quite as well, but date tables are small enough to have negligible difference.</p>

<p>Mark Table as Date Table. Dates must not duplicate, and not have gaps.</p>

<p>Best Practice - Turn off Auto DateTime, as it builds a hidden date table for each datetime column in the entire data model.</p>

<p>Composite models allow a combination of imported tables and DirectQuery tables. Relationships between imported and DirectQuery tables default to many-to-many, but can be changed. It defauls to many-to-many because it can’t detect nor assume uniqueness for the DirectQuery table.</p>

<p>Many-to-many relationships are now supported and can replace the tradtional bridge table method. The important bit to remember is to still use single-direction filter propogation. Marco Russo has a very good <a href="https://www.youtube.com/watch?v=qMs8YIpcqMs">presentation</a> on this.</p>

<p>Aggregations are a powerful feature for combining DirectQuery detail data with the performance of imported data. Aggregations import some higher grain of the detail data. A key supporting feature is Dual mode for related dimension tables. Dual mode imports the data for DAX queries against the aggregation, and treating the table as DirectQuery when relating to the detail data. This is a very important performance feature to understand.</p>

<p>More reading:</p>

<ul>
  <li><a href="https://docs.microsoft.com/en-us/power-bi/transform-model/desktop-aggregations">Manage Aggregatons</a></li>
  <li><a href="https://docs.microsoft.com/en-us/power-bi/transform-model/desktop-aggregations">Use Composite Models</a></li>
  <li><a href="https://docs.microsoft.com/en-us/power-bi/transform-model/desktop-storage-mode">Manage Storage Mode</a></li>
</ul>

<p>Data models support both hierarchis, display folders, and table/column hiding to better organize the columns used in analysis. Good model design = good UI design.</p>

<h3 id="ii-introduction-to-creating-measures-using-dax-in-power-bi">II. Introduction to creating measures using DAX in Power BI</h3>

<p>Calculated columns are materialized at data refresh. They do not compress as well as imported columns, meaning they consume more memory.</p>

<p>A simple formula to demonstrate non-additive measure pattern:</p>

<pre data-enlighter-language="sql">
Last Inventory Count =
CALCULATE (
    SUM ( 'Warehouse'[Inventory Count] ),
    LASTDATE ( 'Date'[Date] ))
</pre>

<p>Every time the measure is evaluated, it uses the latest date visible in the filter context.</p>

<p>Tables that only have measures visible (all columns hidden) are displayed at the top of the fields list with a different icon.</p>

<h3 id="iii-optimize-a-model-for-performance-in-power-bi">III. Optimize a model for performance in Power BI</h3>

<p>A good data model in THE key to accurate numbers and good performance.</p>

<p>In general, reduce the size of the data model by:</p>

<ul>
  <li>Removing unnecessary columns</li>
  <li>Remove unnecessary Date/Time hierarchies (turn off Auto date/time option)</li>
  <li>Reduce cardinality as much as possible. For example, use qty * price instead of a higher cardinality sales column</li>
  <li>Avoid calculated columns</li>
  <li>Use the star schema design pattern</li>
  <li>Push detail grain to DirectQuery and store higher-grain as aggregations</li>
</ul>

<p>Read more: <a href="https://docs.microsoft.com/en-us/power-bi/guidance/import-modeling-data-reduction">Data reduction techniques for Import modeling</a></p>

<p>Power BI Desktop has a Performance Analyzer to show time elapsed for each visual and the generated DAX. Be aware of the visual cache and the storage cache. To clear both:</p>

<ul>
  <li>Create a new blank report page in Power BI Desktop.</li>
  <li>Close and re-open Power BI Desktop</li>
  <li>Start the Performance Analyzer (while still on the blank report page)</li>
  <li>Finally, open the report page to analyze</li>
</ul>

<p>Direct Query does not support Quick Insights and Q&amp;A in the Power BI service.</p>

<p>To minimize lag on visuals refreshing, you can reduce the number of queries using options called Query Reduction. This allows disabling automatic visual interaction, manually apply slicer interaction (via a button), options for applying filters (via buttons to apply as you go or apply all).</p>

<p>Read more about DirectQuery:</p>

<ul>
  <li><a href="https://docs.microsoft.com/en-us/power-bi/connect-data/desktop-directquery-about">About using DirectQuery in Power BI</a>.</li>
  <li><a href="https://docs.microsoft.com/en-us/power-bi/guidance/directquery-model-guidance">DirectQuery model guidance in Power BI Desktop</a>.</li>
</ul>

<p>Aggregations can be used to improve query performance of DirectQuery. The aggregation table can either be in-memory or DirectQuery. Raed more on Aggregations: <a href="https://docs.microsoft.com/en-us/power-bi/transform-model/desktop-aggregations">Use aggregations in Power BI Desktop</a>.</p>

<h2 id="visualize-data-in-power-bi">Visualize data in Power BI</h2>

<p><a href="https://docs.microsoft.com/en-us/learn/paths/visualize-data-power-bi/">4 modules</a></p>

<h3 id="i-work-with-power-bi-visuals">I. Work with Power BI visuals</h3>

<p>Types of visuals:</p>

<p>Clustered vs stacked bar chart - clutered show the total while stacked shows the breakdown of the total.</p>

<p>Line vs area chart - area chart is just a line chart filled in.</p>

<p>Pie chart vs donut vs tree map - A donut chart is a pie chart with the middle missing for a label. A tree map is a square pie chart essentially.</p>

<p>Combo chart - combinds a bar chart and a line chart.</p>

<p>Card - single data point.</p>

<p>Funnel charts - Good for showing values for a sequential process e.g. sales lead conversion.</p>

<p>Gauge chart - progress towards a goal.</p>

<p>Waterfall/bridge chart - shows a running total as increases/decreases.</p>

<p>Scatter chart - good for analyzing a large set of data points over time.</p>

<p>Maps - requires the specific data sources to be categorized for use.</p>

<p>Slicer - For filtering data on other visuals.</p>

<p>Q&amp;A - Allows natural language questions and answers. A good data model and adding meta data (synonyms) can improve this experience. QA has these components:</p>

<ol>
  <li>The question box, for typing question (and shown suggestions)</li>
  <li>A pre-populated list of suggested questions</li>
  <li>An icon that users can select to convert the Q&amp;A visual into a standard visual.</li>
  <li>An icon that users can select to open Q&amp;A tooling, which allows designers to configure the underlying natural language engine.</li>
</ol>

<p>Tooltips - Tooltips support data fields. Also, they support displaying a report (that has been registered as a tooltip).</p>

<p>Custom visuals - Can be imported from AppSource or Your Organizations gallery. Custom visuals must be imported each time you start developing a new report.</p>

<p>R/Python visual - Need to enable script visual and configure the runtime.</p>

<p>KPIs - Needs three items: 1) a goal, 2) a unit of measurement, and 3) a time-series.</p>

<h3 id="ii-create-a-data-driven-story-with-power-bi-reports">II. Create a data-driven story with Power BI reports</h3>

<p>Power BI desktop provides tools for aligning, resizing the report and the layout within in.</p>

<p>Accesibility features built-in:</p>

<ul>
  <li>Keyboard navigation</li>
  <li>Screen-reader compatibility</li>
  <li>High contrast colors view</li>
  <li>Focus mode</li>
  <li>Show data table</li>
</ul>

<p>Accesibility features to configure:</p>

<ul>
  <li>Alt text</li>
  <li>Tab order</li>
  <li>Titles and labels</li>
  <li>Markers</li>
  <li>Themes</li>
</ul>

<p>The following features work together:</p>

<ul>
  <li>Bookmarks capture the state of a view of the report, allowing to quickly return/restore it.</li>
  <li>Selections allow you to enable/disable items from the bookmark. This is viewable in the slection pane.</li>
  <li>Buttons have actions, one of which is to display a bookmark.</li>
</ul>

<p>Button: conditional formatting based on a measure can include the action.</p>

<p>Cross-report drill-through - Can be enabled/disabled in Power BI Deskop options and/or Power BI service. Allow a report to drill-through to a different report. Note: Navigation ‘Back’ button will be created automatically but should be deleted because it ‘Back’ only work within navigation within a report.</p>

<p>Conditional formatting has many Excel-like options like highlighting and color bars.</p>

<p>Slicers vs filters - slicers are additional DAX query to populate all values before selection (because it is a visual). Filters are not a visual and do not generate an additional DAX query.</p>

<p>Types of slicers:</p>

<ul>
  <li>Numeric range slicers</li>
  <li>Relative date slicers</li>
  <li>Relative time slicers</li>
  <li>Responsive, resizable slicers</li>
  <li>Hierarchy slicers with multiple fields</li>
</ul>

<p>More reading: <a href="https://docs.microsoft.com/en-us/power-bi/visuals/power-bi-visualization-slicers">Slicers</a></p>

<p>The filter pane allows:</p>

<ul>
  <li>Show/hide the filter pane</li>
  <li>Show/hide specific filters</li>
  <li>Lock a specific filter i.e. not editable by the report consumer</li>
  <li>Filtering at visual, report, all report, or drill-through</li>
</ul>

<p>Power BI service supports anayzing through Excel and exporting to CSV, Excel, and PDF.</p>

<p>The report editor lets you switch between regular and mobile design views. The mobile app serves up the mobile version of the report.</p>

<p>Sync slicer does just what is says – allows slicer value to stay synced across selected reports</p>

<h3 id="iii-create-dashboards-in-power-bi">III. Create dashboards in Power BI</h3>

<p>Dashboards vs Reports</p>

<ul>
  <li>Dashboards can be created from multiple datasets or reports.</li>
  <li>Dashboards do not have the Filter, Visualization, and Fields panes that are in Power BI Desktop, meaning - that you can’t add new filters and slicers, and you can’t make edits.</li>
  <li>Dashboards can only be a single page, whereas reports can be multiple pages.</li>
  <li>You can’t see the underlying dataset directly in a dashboard, while you can see the dataset in a report - under the Data tab in Power BI Desktop.</li>
  <li>Both dashboards and reports can be refreshed to show the latest data.</li>
</ul>

<p>Besides pinning tiles to dashbords, tiles can be created on the dashboard of text boxes, images, videos, streaming data, and web content.</p>

<p>Dashboards support pinned reports named “Live Page” because as the data is refreshed, so will the tile in the dashboard. You can also interact with them, unlike other tiles.</p>

<p>Dashoards support themes, both out-of-the-box themes and custom themes authored as JSON.</p>

<p>Question in Learning Path I got wrong - In both reports and dashboards, you can use the slicers and filter by selecting a data point. Hmmm.</p>

<p>Data alerts are only in the power BI service for certain visuals: KPI visuals, gauges, and cards. Alerts will show an alert icon over the tile (though sometimes the browser cache requires F5 reload) and an optional email.</p>

<p>Report users can configure their own set of alerts.</p>

<p>Q&amp;A - Natural-language interface for the data. Three main components:</p>

<ol>
  <li>Question box</li>
  <li>Pre-populated suggestion tiles</li>
  <li>Pin visual icon</li>
</ol>

<p>Real-time data is supported through streaming datasets. These are stored in cache and do not support data modeling. Tiles on a dashboard are bound directly to the streaming dataset.</p>

<p>Read more: <a href="https://docs.microsoft.com/en-us/power-bi/connect-data/service-real-time-streaming">Real-time streaming in Power BI</a></p>

<p>Data clasification - a way to tag reports as informational awareness ONLY; no actual security is enforced by the Power BI service.</p>

<p>Phone view in the dashboard is customizable for each user.</p>

<p>When pinning visuals to a dashboard, they retain whatever filter context is selected. Tip: Use relative date slicers e.g. Current Week, Current Month, etc.</p>

<h3 id="iv-create-paginated-reports">IV. Create paginated reports</h3>

<p>Paginated reports are basically SSRS, and only for Premium Capacity (or the new Premium-per-user license). Best use: Operational reports and tabular formatted data.</p>

<p>Not built in Power BI Desktop or the service; built with Power BI Report Builder, basically a newer version of the SSRS Report Builder app.</p>

<p>Paginated reports can connect to Power BI datasets. It uses the MDX editor, not the SQL editor in those cases.</p>

<h2 id="data-analysis-in-power-bi">Data analysis in Power BI</h2>

<p><a href="https://docs.microsoft.com/en-us/learn/paths/perform-analytics-power-bi/">2 modules</a></p>

<h3 id="i-perform-analytics-in-power-bi">I. Perform analytics in Power BI</h3>

<p>Power BI has several tools for advanced analytics:</p>

<ul>
  <li>Groups - manually group attributes.</li>
  <li>Bins - create bins on numeric data.</li>
  <li>Clustering - an option on scatter chart visual (any others?) to color clusters of points using statistical analysis</li>
  <li>Time-series analysis - Scatter chart has a play axis visual to animate data changing over time</li>
  <li>Analyze feature - On visuals, the analyze feature can explain increase/decreas or why a distribution is different. Read more about <a href="https://docs.microsoft.com/en-us/power-bi/create-reports/desktop-insights-find-where-different">Analyze</a></li>
  <li>Quick Insights - Machine-learning algoriths run on the data set (Power BI service only; imported datasets only). The insights results cards let you drill-down more with scoped insights.</li>
  <li>AI Insights - Text Analytics, Vision, and Azure Machine Learning. Text and vision require Premium Capacity license.</li>
</ul>

<h3 id="ii-work-with-ai-visuals-in-power-bi">II. Work with AI visuals in Power BI</h3>

<p>The Q&amp;A feature is part of both the Power BI service and Power BI Desktop! Q&amp;A is meta-data driven. Q&amp;A will underline unrecognized words with a squiggly red line. Some metadata is derived, but Q&amp;A setup lets you:</p>

<ul>
  <li>Review question - see all questions asked</li>
  <li>Teach Q&amp;A - an easy way to define unknown terms</li>
  <li>Manage terms - Review/edit/add/delete terms</li>
</ul>

<p>Q&amp;A is displayed above dashboards automatically. You can also add a Q&amp;A visual or a Q&amp;A button to a report in Power BI desktop.</p>

<p>Key influencers - a visual that illustrates the factors affecting a metric</p>

<p>Decomposition trees - a visual that will automatically breakdown/drill-down measures. Selecting the AI ‘high value’ or ‘low value’ option will determine the most relevant combinations for each.</p>

<p>AI splits consider all available fields and determine which one to drill into to get the highest/lowest value of the measure analyzed.</p>

<h2 id="manage-workspaces-and-datasets-in-power-bi">Manage workspaces and datasets in Power BI</h2>

<p><a href="https://docs.microsoft.com/en-us/learn/paths/manage-workspaces-datasets-power-bi/">3 modules</a></p>

<h3 id="create-and-manage-workspaces-in-power-bi">Create and manage workspaces in Power BI</h3>

<p>Workspaces are centralized repositories of reports, dashboards, and datasets that offer collaboration and security.</p>

<p>Workspace built-in roles:</p>

<ul>
  <li>Admin
    <ul>
      <li>Publish/edit/delete content</li>
      <li>Add/remove users</li>
      <li>Publish/edit/delete app (bundled content)</li>
      <li>Schedule data refreshes</li>
    </ul>
  </li>
  <li>Member
    <ul>
      <li>Publish/edit/delete content</li>
      <li>Publish/edit/delete app (bundled content)</li>
      <li>Schedule data refreshes</li>
      <li>Cannot add/remove users, delete workspace, or edit workspace metadata</li>
    </ul>
  </li>
  <li>Contributor
    <ul>
      <li>Publish/edit/delete content</li>
      <li>Schedule data refreshes</li>
    </ul>
  </li>
  <li>Viewer
    <ul>
      <li>View reports/dashboards</li>
      <li>Read dataflow data</li>
    </ul>
  </li>
</ul>

<p>If the workspace is backed by a Premium capacity, a non-Pro user can view content within the workspace under the Viewer role.</p>

<p>The following are assignable to roles:</p>

<ul>
  <li>individual users</li>
  <li>mail-enabled security groups</li>
  <li>distribution lists</li>
  <li>Microsoft 365 groups</li>
  <li>regular security groups (AD, I assume)</li>
</ul>

<p>App - a published, read-only window into your data for mass distribution and viewing. Apps require Pro license to create AND view. As noted above, if backed by Premium Capacity, then Pro license for creating/publish, not for consumption.</p>

<p>App permissions include:</p>

<ul>
  <li>Build - allow consumers to build new content from the app datasets</li>
  <li>Copy - copy the app into another workspace.</li>
  <li>Share - Allow to share with others</li>
</ul>

<p>After publishing the app, you can edit the app in the workspace, but changes are not published until the ‘Update app’ action</p>

<p>Usage and performance metrics are only for Pro license, and roles admin, member, or contributor. They include variations on views and time to open.</p>

<p>Premium Capacity has deployment pipelines where workspaces can have development, test, and production designations. Dev has ‘Deploy to Test’ option. Test allows creating testing rules and ‘Deploy to Prod’ option. Test and prod give the option of replacing the data source (so that prod can point to a prod datasource, for example).</p>

<p>Read more: <a href="https://docs.microsoft.com/en-us/power-bi/create-reports/deployment-pipelines-best-practices">Deployment Pipeline Best Practices</a></p>

<p>The data lineage view illustrates datset to report to dashboard dependecies. The dataset card also display last refresh date, and offer a manual refresh option. The card also has an impact analysis option, which can show cross-workspace dependencies.</p>

<p>Data protection features:</p>

<ul>
  <li>Sensitivity lables - built-in (None, Personal, General, Confidential, and Highly confidential) and also custom labels supported (through Microsoft 365 security center). Can be assigned to content. Does not prevent export, but exports the label for supporting applications (PDF, Excel, PowerPoint).</li>
</ul>

<p>Not on exam, but Power BI supports both classic and new workspaces. Read more: <a href="https://docs.microsoft.com/en-us/power-bi/collaborate-share/service-new-workspaces">New Workspaces</a></p>

<h3 id="manage-datasets-in-power-bi">Manage datasets in Power BI</h3>

<p>Data sources support parameters, defined in Power Query editor. Even the data source connection string/properties can be parameterized. Parameter values can be pre-defined, or come from another query.</p>

<p>What-if parameters - enable running scenarios by generating a sequence of values (start, end, and increment defined by report author). Then create a new ‘forecast’ measure that uses the parameter with a defined measure (typically multiply). On the report, the value of the What-If parameter can be changed via a slicer. All this could be done manually, but the What-If parameter functionality streamlines the process.</p>

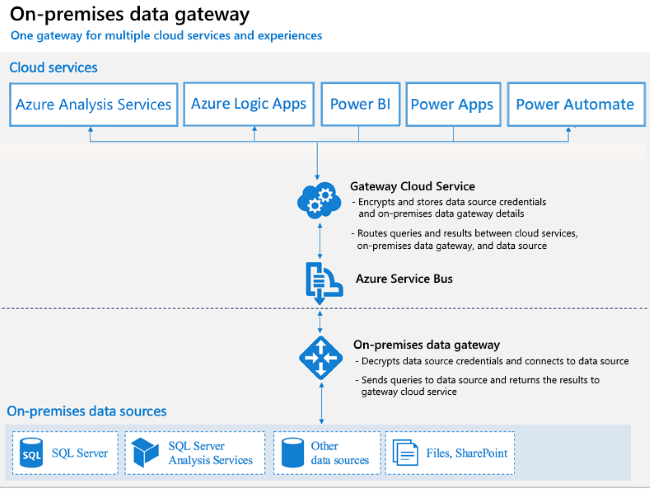
<p>Power BI gateway - Oragnizational and Personal modes. Installed on on-prem server or workstation. Actually named On-Prem Gateway, and the same tool supports many Microsoft cloud integration tools.</p>

<p><img src="/assets/img/az104/on-prem-data-gateway.png" alt="https://docs.microsoft.com/en-us/learn/modules/manage-datasets-power-bi/media/4-how-gateway-works-ss.png" /></p>

<p>Scheduled refresh - 8 per day, or 48 per day on Premium Capacity. The schedule disables after four consectutive refresh failures.</p>

<p>Incremental refresh - a simplified way for partition refresh (the traditional incremental refresh tactic). The date source MUST support query folding. The steps:</p>

<ol>
  <li>Define the filter parameters (must be named RangeStart and RangeEnd)</li>
  <li>Use the parameters to apply a filter (in Power Query, greater than or equal to RangeStart and less than RangeEnd)</li>
  <li>Define the incremental refresh policy (on the table in the dataset, define rows to keep and rows to refresh. Power BI figures out the actual partition logic)</li>
  <li>Publish changes to Power BI service.</li>
</ol>

<p>Endorsement - badge icons on datasets for confidence and clarity</p>

<ul>
  <li>Promoted - any role but Viewer</li>
  <li>Certified - request certification/endorsement. Power BI admin can define who can certify.</li>
</ul>

<p>Query caching (Premium Capacity only) - cache is specific to a user and report page.</p>

<h3 id="implement-row-level-security">Implement row-level security</h3>

<p>Row-level security (RLS) uses a DAX filter as the core logic mechanism. The RLS can be static or dynamic. The roles (and RLS) can be tested in Power BI Desktop or Power BI service via ‘View As Role’ functionality. The steps are similar in both:</p>

<ol>
  <li>Define a role</li>
  <li>Add a DAX expression to limit table(s)</li>
  <li>Add users to role</li>
</ol>

<p>Static - Hard-coded value e.g. [department] = ‘game’</p>

<p>Dynamic - Uses userprincipalname() function that differs per user e.g. [emailAddress] = userprincipalname()</p>]]></content><author><name></name></author><category term="data" /><category term="analysis" /><summary type="html"><![CDATA[Passing the DA-100 Exam - Study Notes]]></summary></entry><entry><title type="html">Embrace the Side-Quests</title><link href="http://lance-england.com/2020/11/side-quests.html" rel="alternate" type="text/html" title="Embrace the Side-Quests" /><published>2020-11-06T00:00:00+00:00</published><updated>2020-11-06T00:00:00+00:00</updated><id>http://lance-england.com/2020/11/side-quests</id><content type="html" xml:base="http://lance-england.com/2020/11/side-quests.html"><![CDATA[<h1 id="embrace-the-side-quests">Embrace the Side-Quests</h1>

<p>What are side-quests? In video games, they are tasks given to the player that have no direct bearing on the main story/campaign of the game. Completion of a side-quest often results in the acquisition of money, items, or unlocks another side-quest.</p>

<p>Careers in technology are filled with goals and side-quests. However, unlike video games, I believe career side-quests DO have a direct bearing on your journey.</p>

<p>For example, I am currently working on my cloud and devops skills, perhaps even sitting the exam for the <a href="https://docs.microsoft.com/en-us/learn/certifications/exams/az-400">Azure DevOps Engineer certification</a>. Before I begin studying for the AZ-400 exam, I need to study for one of the pre-requisites. I’ve chosen the <a href="https://docs.microsoft.com/en-us/learn/certifications/azure-administrator">AZ-104 Azure Administrator</a> exam. As I work through the areas of knowledge, I realize I really need to improve my networking skills. Right, fine, so I stop AZ-104 preparation to learn some networking fundamentals on PluralSight. I’ve been watching a great course by Ross Bagurdes called <a href="https://app.pluralsight.com/library/courses/comptia-network-plus-networking-concepts/table-of-contents">Networking Concepts and Protocols</a>. When I get through the section on subnetting, I realize that this is important and I want to dive in a little more. Fine, pause there, and watch another great PluralSight course by Ross called <a href="https://app.pluralsight.com/library/courses/network-layer-addressing-subnetting/table-of-contents">Network Layer Addressing and Subnetting</a>.</p>

<p>Whew. To summarize, my current side-quest is AZ-400 -&gt; AZ-104 -&gt; Networking fundamentals -&gt; Subnetting. Once I finish up the networking fundamentals, I will get back to working through the AZ-104 material and I’m sure there will be more areas I will want to pause and dive a little deeper.</p>

<p>My point is, you should always be prepared to take side-quests because it means aquiring valuable skills. Be patient. Embrace the process. There is a literal infinite amount of knowledge to learn, so focus on a direction, and understand the journey is part of the quest.</p>]]></content><author><name></name></author><summary type="html"><![CDATA[Embrace the Side-Quests]]></summary></entry><entry><title type="html">PowerShell and Zip files</title><link href="http://lance-england.com/2020/02/powershell-and-zip-files.html" rel="alternate" type="text/html" title="PowerShell and Zip files" /><published>2020-02-06T00:00:00+00:00</published><updated>2020-02-06T00:00:00+00:00</updated><id>http://lance-england.com/2020/02/powershell-and-zip-files</id><content type="html" xml:base="http://lance-england.com/2020/02/powershell-and-zip-files.html"><![CDATA[<h1 id="powershell-and-zip-files">PowerShell and Zip files</h1>

<p>Another day, another problem that PowerShell helped solve quickly and easily.</p>

<p>During the course of a typical work day, often I will have a problem in front of me that just needs a quick and easy solution. In these cases, more often than not, PowerShell has been my tool of choice.</p>

<p>Yesterday, I needed to cross-reference a large set of files in an archive directory against data from a SQL Server. The challenge was that the files were zipped, and the field to cross-reference was a string of text embedded in a fixed-width format.</p>

<p>The data I needed from SQL Server I queried from SSMS and copy/pasted into Excel. For the zipped file data, I used the (slightly scrubbed) script below.</p>

<p>Now, I’ll admit, if I wanted to be extra fancy I would have queried the SQL Server from PowerShell (maybe with the <a href="https://dbatools.io/">dbatools</a> module) and then created the Excel file from Doug Finke’s <a href="https://github.com/dfinke/ImportExcel">ImportExcel</a> module. However, time was a priority, so I just added all the cross-reference data I needed to a <a href="https://docs.microsoft.com/en-us/dotnet/api/system.text.stringbuilder?view=netframework-4.8">StringBuilder</a> object and copied the full string to the clipboard and then I pasted into Excel. I quick VLOOKUP formula later and I had what I needed.</p>

<h2 id="notes">Notes</h2>

<p>You have to reference the System.IO.Compression.FileSystem assembly. The call to System.IO.Path.GetTempFileName() creates a file and returns the path. I did not see an option to overwrite files during the zip extraction, so I delete the temp file first, and also after for cleanup. Also, I used Write-Host for me, and <a href="https://twitter.com/jsnover/status/727902887183966208?lang=en">it no longer kills puppies</a>.</p>

<p><img src="/assets/img/pug.jpg" alt="Puppies are no longer harmed by Write-Host" /></p>

<p>If anybody has suggestions for improvement, reach out via one of the contact links at the bottom of the web site.</p>

<pre data-enlighter-language="shell">
Clear-Host
Add-Type -assembly "System.IO.Compression.FileSystem"
$sb = New-Object -TypeName System.Text.StringBuilder

Write-Host "$(Get-Date)"
Get-ChildItem -Path '\\company.fileshare\blahblah\file\archive' |
    Select-Object FullName |
    ForEach-Object {
        $tmpFilePath = [System.IO.Path]::GetTempFileName()
        $archive = [System.IO.Compression.ZipFile]::OpenRead($_.FullName)

        [System.IO.File]::Delete($tmpFilePath) |Out-Null
        [System.IO.Compression.ZipFileExtensions]::ExtractToFile($archive.Entries[0], $tmpFilePath) | Out-Null

        $contents = [System.IO.File]::ReadAllLines($tmpFilePath)
        $filekey = $contents[0].Substring(4, 17)
        $sb.AppendLine($filekey) |Out-Null
        [System.IO.File]::Delete($tmpFilePath) |Out-Null
    }
    if ($sb.Length -gt 0) {
        [System.Windows.Forms.Clipboard]::SetText($sb.ToString()) |Out-Null
        Write-Host "List set to clipboard"
    }
Write-Host "$(Get-Date)"
</pre>

<p><a href="https://www.pexels.com/@steshkawillems?utm_content=attributionCopyText&amp;utm_medium=referral&amp;utm_source=pexels">Photo by Steshka Willems from Pexels</a></p>]]></content><author><name></name></author><category term="automation" /><summary type="html"><![CDATA[PowerShell and Zip files]]></summary></entry><entry><title type="html">SQL Saturday #919 Recap</title><link href="http://lance-england.com/2019/10/sqlsaturday919.html" rel="alternate" type="text/html" title="SQL Saturday #919 Recap" /><published>2019-10-21T00:00:00+00:00</published><updated>2019-10-21T00:00:00+00:00</updated><id>http://lance-england.com/2019/10/sqlsaturday919</id><content type="html" xml:base="http://lance-england.com/2019/10/sqlsaturday919.html"><![CDATA[<h1 id="sql-saturday-919-recap">SQL Saturday #919 Recap</h1>

<p>October 19, 2019 was <a href="https://www.sqlsaturday.com/919/Sessions/Schedule.aspx">SQL Saturday Atlanta #919 BI Edition</a>, and the event was really fun and educational. Thanks to the organizers, sponsors, speakers, and attendees.</p>

<p>I presented on <a href="https://www.sqlsaturday.com/919/Sessions/Details.aspx?sid=96128">DAX Fundamentals</a>. The slide deck and demos can be found on the event session page, and also on my <a href="https://lance-england.com/about">About Me</a> page. Thank you to all that attended. I hope I was able to make some of the tricky parts of DAX less tricky.</p>

<p>While there, I attended great sessions on PySpark by <a href="https://www.sqlsaturday.com/919/Speakers/Details.aspx?spid=5783">Brad Llewellyn</a>, Row Level Security Patterns in Power BI by <a href="https://www.sqlsaturday.com/919/Speakers/Details.aspx?name=reza-rad&amp;spid=785">Reza Rad</a>, AI for the Masses by <a href="https://www.sqlsaturday.com/919/Speakers/Details.aspx?spid=4929">Ryan Wade</a>, and Aggregations in Power BI by <a href="https://www.sqlsaturday.com/919/Speakers/Details.aspx?spid=4893">Shabnam Watson</a>. All presenters did a really good job.</p>

<p>The <a href="https://improving.com/location/atlanta">Improving Atlanta</a> team was represented well as a main sponsor, part of the organizer team, and with seven session speakers.</p>

<p><img src="/assets/img/sqlsat919-group.jpg" alt="Improving Atlanta at SQL Saturday 919, Oct 19, 2019" /></p>]]></content><author><name></name></author><category term="data" /><summary type="html"><![CDATA[SQL Saturday #919 Recap]]></summary></entry></feed>